
A tight antibody that also passed developability: Our performance in the AIntibody Challenge
A tight antibody that also passed developability: Our performance in the AIntibody Challenge
Twenty-nine organizations submitted antibody designs blind. Cradle’s design challenge entry came back at 8.69 pM, and cleared the developability criteria.

Franzi

Paul
Franzi
Paul
Last year, Cradle was one of 29 organizations to participate in the AIntibody Challenge: Design antibodies against the same antigen and lock their sequences in before anything was expressed. Every entry expressed as a full-length IgG by a single vendor. Affinity and developability were measured blindly–the labs doing the testing did not know whose antibody was in which tube. The results are now published in Nature Biotechnology.
tl;dr: Executive summary
Twenty-nine organizations submitted antibody designs to a benchmark, in a binding affinity challenge with a similar setup as CASP, the respected structure-prediction competition. Cradle's best design bound the target at 8.69 pM, second of 23 organizations. Authors of the analysis of all results, published in Nature Biotechnology, identified Cradle’s candidate as the tightest when accounting for limitations in the developability scoring (a set of tests predicting whether a molecule will survive manufacturing and formulation). Out of the top 10 (leaving aside developability) our designs rank 3, 4 ,5 and 9. Filtering out those with developability issues, our variants we rank 2, 3, and 7. So our approach has the highest coverage on top performing binders. The training data included in the challenge was a yeast-display screening readout plus one plate of affinity data (training data included), which is roughly what a user has after the first round of a campaign, and we report in the post where the approach fell short as well as where it worked.
Three challenges ran in parallel: an affinity maturation challenge to design improved CDRs from the selection data, an affinity ranking challenge to pick the highest-affinity sequence already present in the sequencing data within three heavy-chain CDR3 clusters, and an antibody design challenge to come up with novel CDR designs. We entered the second and third challenge.
Our top binder in the design challenge came back at 8.69 pM, placing us second of 23 organizations on affinity. The top entry and the next-best after us both failed the developability threshold, which ours passed. The paper itself flagged these flaws as likely disqualifying for a clinical candidate.
That leaves our 8.69 pM design as the best developable antibody produced in the challenge, statistically level with the 9.2 pM best that the experimental campaign found by selection.
What we are proudest of: Our coverage in the top ranked candidates. Out of the top 10 (leaving aside developability) our designs rank 3, 4 ,5 and 9. With developability we rank 2, 3, and 7. So our approach has the highest coverage on top performing binders.
What makes these results particularly interesting for us was that we entered with a deliberately stripped-down pipeline, removing proprietary components we weren’t willing to disclose in a public competition. On top of that, our platform has advanced considerably in the 22 months since. That makes this a conservative benchmark for what Cradle can do today.
How the benchmark was built
AIntibody was modeled on CASP, the structure-prediction competition that pushed that field toward honest self-assessment. The organizers closed most of the usual escape routes: Sequences were submitted before expression, so nobody could screen first and report later. In total, 511 antibodies were expressed and measured, with entries coming from academic labs, large pharma, mid-size biotech, AI biotechs and big tech.
The target was the receptor-binding domain of SARS-CoV-2, picked because it is about as well characterized as an antigen gets. Everyone received the same sequencing readout from a yeast-display selection campaign, plus measured affinities for 142 antibodies.
What makes this benchmark different
Most reported results in computational protein design are retrospective. A group runs its method, picks what to show, and publishes. AIntibody was modeled on CASP, the structure-prediction competition that ran for two decades and eventually made that field's claims trustworthy. Both worked the other way around: Participants submitted sequences before pre-synthesis, so nobody could run a design, see the data, and then decide which results to report. A single vendor manufactured every antibody in the same format, which removes the possibility that one group's numbers look better because of how their molecules were produced. The labs doing the measuring were blind to whose antibody they were testing. The combination of prospective submission, uniform expression, blinded assay is what separates a benchmark from a press release.
Blinded, prospective, third-party-assayed benchmarks are rare in protein design, and building one on this scale is genuinely hard work. We are super appreciative of the organizers’ pulling this together. We would like to see more of these!
Where we landed
Ranks are naturally going to get the attention, but we care more about our success rate.
In challenge two, every one of our submissions bound the target. The participants as a whole did worse than random: Across the three clusters, only 9.8% to 13.8% of AI submissions improved on the cluster control, while randomly picked clones improved on it 39% of the time.

Our model also performed well ranking the clusters against each other. We predicted 27F would be tightest, then 47F, then 28F. The best binders we measured in each came back in that order.
What no one managed was picking the best clone within a cluster. In that top band, our scores differed by only a few percent while measured affinities differed two-to-five-fold. With only three picks per cluster, that comes down to chance.
In a real campaign, we wouldn't spread picks evenly per cluster, but instead put most of the plate into the highest-ranked cluster, and with the winners already in our top 1%, we feel confident we’d find the best candidate.
Our takeaway: Models built on selection data are good at telling families apart and weak within the HCDR3 cluster. Selection screens tell you where the peaks are, not how high they are or what surrounds them. Solving this requires better screening methods.
From a relevance perspective, the antibody design challenge is most interesting—for us, for the AI use case, and for most customers. All of ours were hits, with three of our ten designs coming in under 10 pM.
For a biologics team, the functional rate is the operationally relevant figure. Seven of our ten cleared the developability panel. That’s a round you can plan a campaign from. Across the challenge as a whole, 30.4% of submissions from all organizations didn't bind at all, which makes the developability question moot.
Across all four entries, all 19 of our submissions bound the target.

Rank-ordered box-and-jitter plots of the top 20 of 23 participating organizations by best SPR affinity, showing the distribution of affinity per organization (in purple) relative to the experimental baseline (in blue). Each plotted point is one independent antibody construct. Boxes show the median (center line), 25th–75th percentiles (bounds) and 1.5× the IQR (whiskers); all individual points are overlaid as jitter. Graphic redesigned (data unchanged) and caption lightly edited from Erasmus, M.F., Bedinger, D., Hopkins, E. et al. “A blinded, prospective benchmark of in silico antibody discovery anchored to experimental affinity and developability.” Nat Biotechnol (2026). https://doi.org/10.1038/s41587-026-03238-6 and reproduced under Creative Commons license
The developability panel, assay by assay
The challenge scored five assays, each marked 0 for passing, 1 for questionable and 2 for failing, with a cumulative score of 3 or less counting as a pass. Thermal stability above 65 °C, aggregation temperature above 64 °C, hydrophobic interaction retention under 13.87 minutes, baculovirus particle polyreactivity under 5.3, AC-SINS self-interaction under 6.69.
Our ten designs passed thermal stability and aggregation across the board. Developability scores were not reported for generating the designs. The candidate we used as template sequence had both poor polyreactivity, and hydrophobicity, which we inherited, and every failure we recorded was hydrophobicity or polyreactivity.
That includes our best binder. Submission 1586, the 8.69 pM design, is questionable on hydrophobic interaction at 14.9 minutes and fails polyreactivity outright at a BVP score of 20.6 against a failing threshold of 10. It reaches a composite of 3 and passes by exactly the allowed margin. Two of our other sub-10 pM designs produced no peak on the hydrophobic interaction column at all.
Why developability sits alongside affinity
Affinity is how tightly an antibody grips its target, and it is the number most discovery programs lead with. Developability is everything else that determines whether a molecule can become a drug: whether it stays folded at body temperature, whether it clumps together at the concentrations needed for a syringe, whether it sticks to surfaces or to proteins it was never meant to bind. These properties are measured in this benchmark across five assays covering thermal stability, aggregation, hydrophobicity, polyreactivity and self-interaction. The reason they belong in the same conversation as affinity is economic. Affinity problems surface early and get fixed with another round of engineering. Developability problems often surface after a lead has been chosen, during scale-up or formulation, when fixing them means going back to a molecule that an entire program has already been built around. We believe that a benchmark that scores both is asking a harder and more realistic question than one that scores affinity alone.
Not included in the report is that the top candidate failed on purification, which would disqualify it as a candidate under standard therapeutic development criteria.
Affinity is the property that moves most readily under optimization (up to a ceiling). In our own first-round antibody campaigns we have seen single rounds produce notable affinity gains without affinity even being the objective. It responds.
The properties that do not respond as cleanly are the ones that kill programs late and expensively. Aggregation, polyreactivity, hydrophobicity, and thermal stability tend to show up as problems after a lead has been selected, when the cost of going back is a program delay rather than a plate. Holding those steady while affinity moves is a part of an antibody campaign that is quite difficult.
The data we trained on
Challenge 3 is worth looking at closely if you are trying to work out where an ML platform earns its place in a discovery workflow. Because the data situation we were given is quite similar to what we have seen in many of the dozens of programs run on Cradle’s platform.
We had a yeast-display selection readout, which is hit identification output. We had one round of affinity measurements on 142 antibodies, which is the first lead-optimization data point.
Why the starting data mattered as much as the model
Participants in the design challenge received two things: sequencing output from a yeast-display selection campaign, which is the kind of data a hit-identification run produces, and measured binding affinities for 142 antibodies, which is the kind of data a first optimization round produces. This is a situation we would typically be in during a campaign–the phase where fine-tuned ML models are no longer just producing data for further training, and become reliable. Some protein engineering workflows treat hit identification and lead optimization as separate stages with separate tooling. The screening data is used to pick leads and then set aside. Training a model on both signals together produced a design tighter than anything the selection campaign itself had found. The screening data was not just a source of candidates, but training data for the optimization that followed.
First we evotuned on the multiple sequence alignment and high read-count screening sequences. We built a predictor with two output heads, one for enrichment in the screening data and one for affinity, trained jointly on both signals. Four folds were ensembled, and a noise-masking procedure turns each prediction into a distribution rather than a single number. So every sequence carries a mean and a confidence range rather than a point estimate. For the design challenge we blocked every position outside the six CDRs so the challenge rule was enforced by the software rather than by inspection, then used a masked language model to infill eight CDR positions at a time across 200,000 masks, deduplicated the output, and scored it with the same ensemble. The ten we submitted were spread across four selection strategies, from conservative ranking to an exploration arm favoring heavier mutation loads.
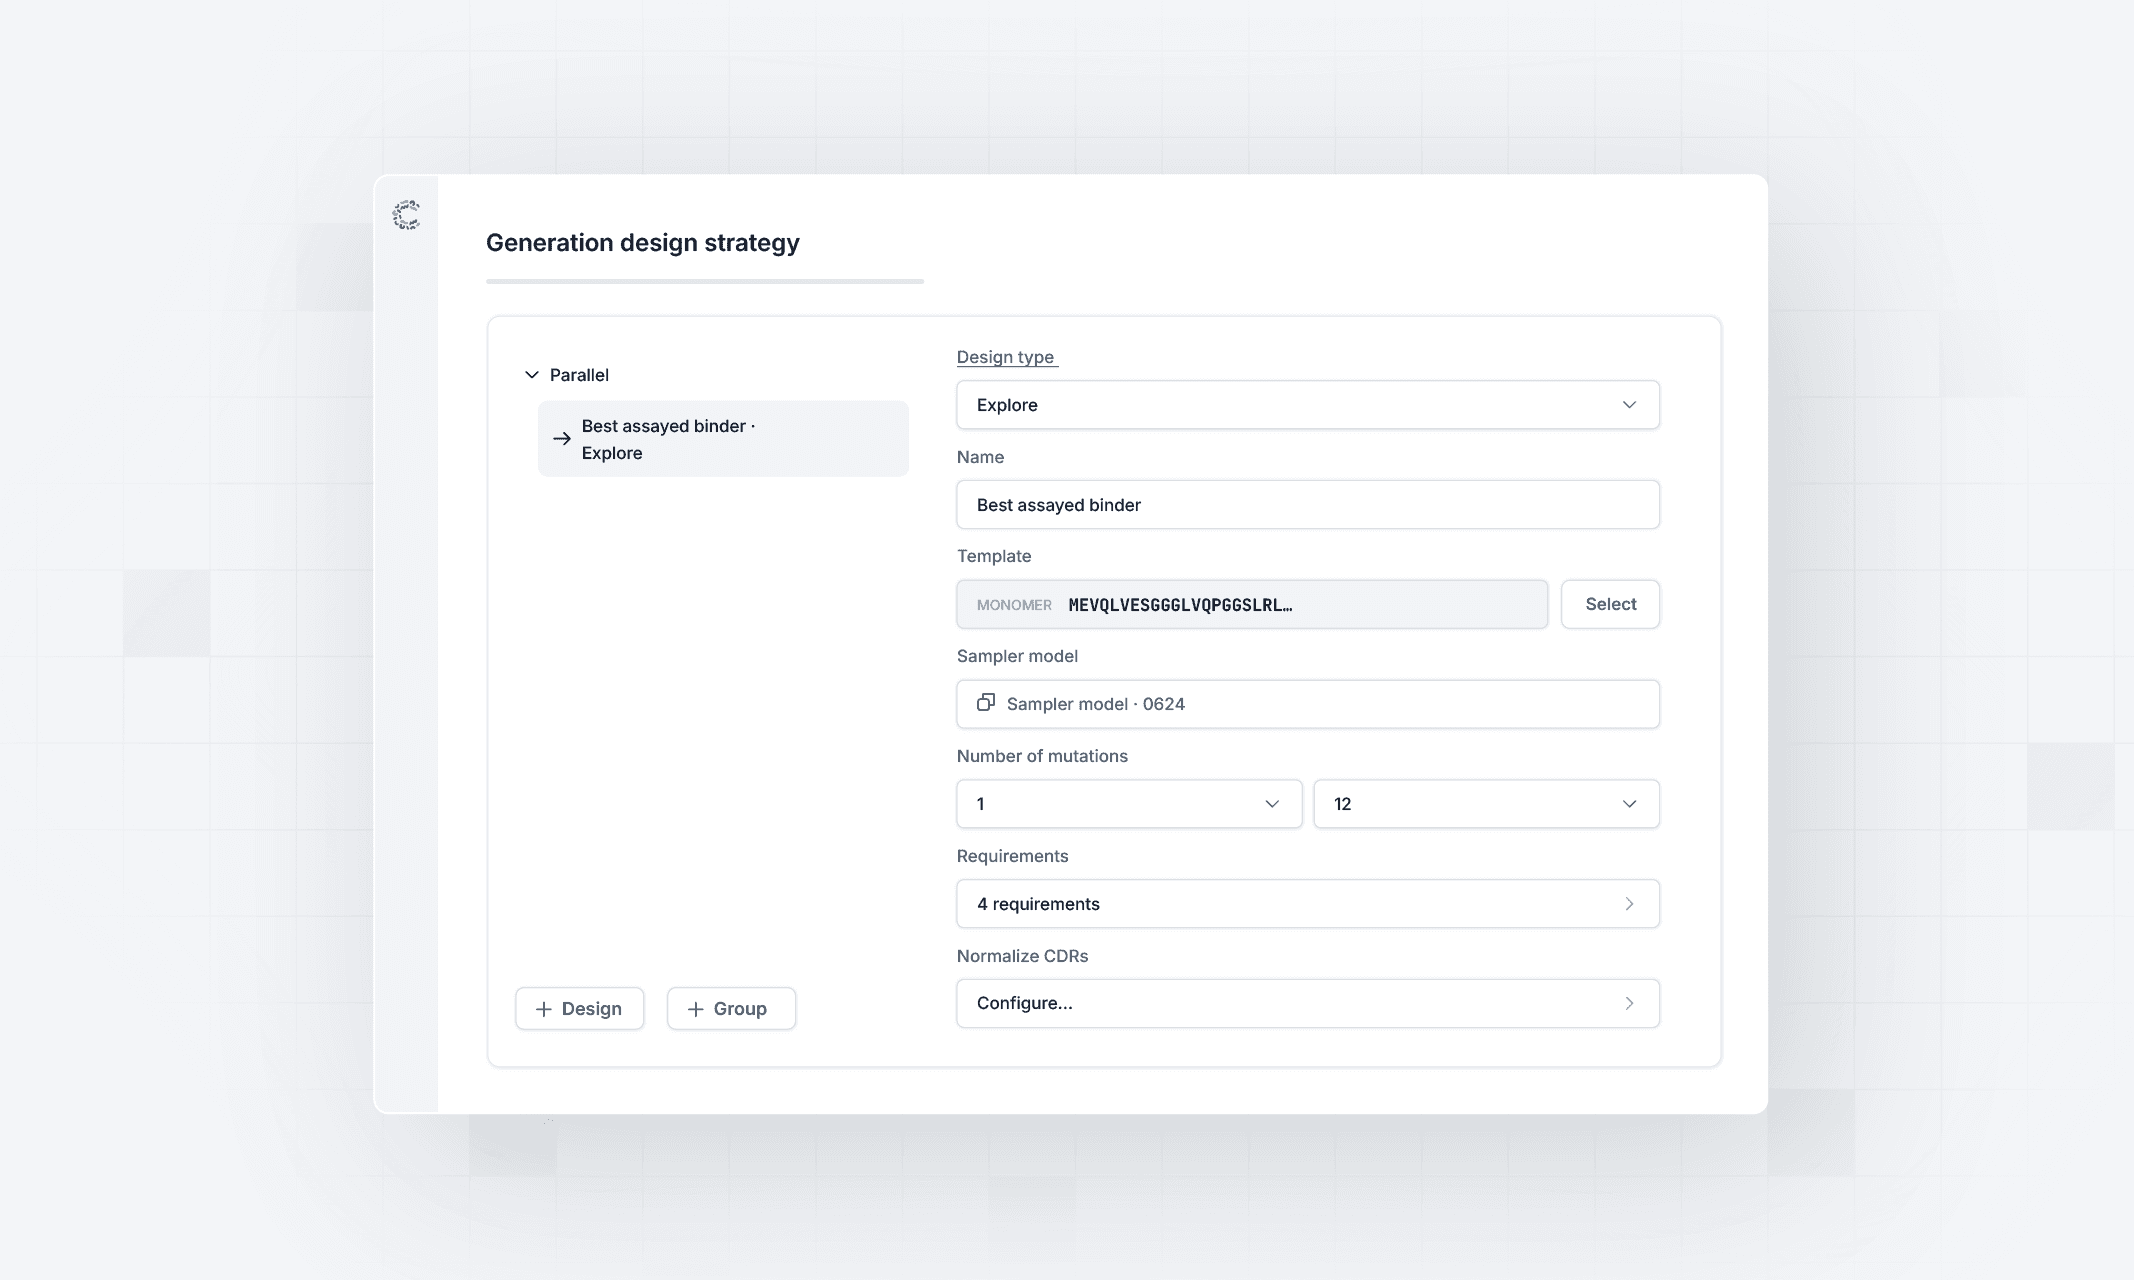
How Cradle generates the designs. The run starts from a template sequence and writes new CDR variants, each with a set number of mutations, all defined within Cradle’s UI. Image not representative of competition submission.
From a selection readout plus one affinity round, with no structural input, that produced a design tighter than anything in the library the selection campaign had generated. This is the argument for running hit ID and early optimization through the same model rather than treating them as sequential, separately-tooled stages: Using the same models to learn from screening data and plate-based binding data maximizes learning. So the screening data becomes not just a source of leads, but training data for the optimization that follows. When you’re doing things the old way, information is lost between those steps.

The run locks every position outside the CDRs, so new sequence appears only in the CDR regions. This enforces the challenge rule in the Cradle platform, together with the scientist’s knowledge. Image not representative of competition submission.
From a selection readout plus one affinity round, with no structural input, that produced a design tighter than anything in the library the selection campaign had generated. This is the argument for running hit ID and early optimization through the same model rather than treating them as sequential, separately-tooled stages: Using the same models to learn from screening data and plate-based binding data maximizes learning. So the screening data becomes not just a source of leads, but training data for the optimization that follows. When you’re doing things the old way, information is lost between those steps.
Where the model had resolution, and where it did not
Earlier in this post we discussed the performance of our predictor in the rank-prediction challenge. Picking the single best sequence inside a cluster is a harder problem, and our within-cluster ordering was much weaker than our between-cluster ordering. The sequences
inside one of these clusters are near neighbors, and a model asked to separate near neighbors is working at a resolution where small prediction differences sit well inside assay variance. (There is more to say about what selection-derived sequencing data can and cannot carry, and we plan to publish that separately.)

Spread across each challenge's ranked submissions. "Best" is the top affinity recorded; "10th best" is the tenth-ranked entry (roughly where a top-10 cutoff would fall). "Top-10 spread" is the ratio between them — how much affinity varies among just the leading submissions. "Full spread" is the same ratio across every entry. In the design challenge, the top 10 alone span a 62-fold range, and the full field spans nearly 100,000-fold. A single best-binder result sits at one end of that wide distribution, which makes for a resolution problem in the top-1 scoring method.The margin of top performers is a lot narrower on the ranking challenge, making it more susceptible to data noise.
That has a practical consequence for how any of this gets scored. Organization ranking here was effectively top-1, with near ties broken by hit rate. Top-1 rewards the single best submission, which carries real variance; hit rate smooths that out but rewards conservative submissions. Our platform optimizes for an average top-N, usually between 5 and 10, because that is the quantity a lab cares about when it advances candidates from a plate, and because it is more stable run to run.
Organizers are already rethinking the developability scoring, noting that the top-ranked antibody’s failure on one assay was “allowed…to be offset by favorable performance elsewhere, [which] exposes a limitation in the present scoring design and the need for critical future go/no-go criteria.” With respect and gratitude to the organizers, we’d add that many sequences “passed” or “failed” by super small margins and didn't include all relevant properties (which is the caveat of the winning sequence), making the cutoff somewhat arbitrary. We’d also like to make two suggestions we think would make the next AIntibody Challenge even more valuable to everyone who entered: Release the per-submission raw data, so the community can recompute rankings under top-3, top-5 or top-10 and see how much the ordering moves. Second, state the scoring metric upfront so entrants can optimize for the thing being measured.
What we left switched off
One caveat on everything above. We ran the generation through a stripped-down manual path, and the final ten picks came from a score ranking rather than the batch-level optimizer that normally decides what goes on a plate. These results reflect our models and our data, not the full platform.
The experiment we would most like to see next is multi-round. This benchmark measured what one pass at a fixed dataset can do. Every campaign we run with a customer is iterative, with each round's assay results retraining the models before the next design, and the gap between one-shot and closed-loop performance is the number nobody has published under blinded conditions yet. If the organizers run a multi-round version, we will enter enthusiastically.
Full results and every participant's data are in Nature Biotechnology. The challenge design and original call for participants are at aintibody.org.
Last year, Cradle was one of 29 organizations to participate in the AIntibody Challenge: Design antibodies against the same antigen and lock their sequences in before anything was expressed. Every entry expressed as a full-length IgG by a single vendor. Affinity and developability were measured blindly–the labs doing the testing did not know whose antibody was in which tube. The results are now published in Nature Biotechnology.
tl;dr: Executive summary
Twenty-nine organizations submitted antibody designs to a benchmark, in a binding affinity challenge with a similar setup as CASP, the respected structure-prediction competition. Cradle's best design bound the target at 8.69 pM, second of 23 organizations. Authors of the analysis of all results, published in Nature Biotechnology, identified Cradle’s candidate as the tightest when accounting for limitations in the developability scoring (a set of tests predicting whether a molecule will survive manufacturing and formulation). Out of the top 10 (leaving aside developability) our designs rank 3, 4 ,5 and 9. Filtering out those with developability issues, our variants we rank 2, 3, and 7. So our approach has the highest coverage on top performing binders. The training data included in the challenge was a yeast-display screening readout plus one plate of affinity data (training data included), which is roughly what a user has after the first round of a campaign, and we report in the post where the approach fell short as well as where it worked.
Three challenges ran in parallel: an affinity maturation challenge to design improved CDRs from the selection data, an affinity ranking challenge to pick the highest-affinity sequence already present in the sequencing data within three heavy-chain CDR3 clusters, and an antibody design challenge to come up with novel CDR designs. We entered the second and third challenge.
Our top binder in the design challenge came back at 8.69 pM, placing us second of 23 organizations on affinity. The top entry and the next-best after us both failed the developability threshold, which ours passed. The paper itself flagged these flaws as likely disqualifying for a clinical candidate.
That leaves our 8.69 pM design as the best developable antibody produced in the challenge, statistically level with the 9.2 pM best that the experimental campaign found by selection.
What we are proudest of: Our coverage in the top ranked candidates. Out of the top 10 (leaving aside developability) our designs rank 3, 4 ,5 and 9. With developability we rank 2, 3, and 7. So our approach has the highest coverage on top performing binders.
What makes these results particularly interesting for us was that we entered with a deliberately stripped-down pipeline, removing proprietary components we weren’t willing to disclose in a public competition. On top of that, our platform has advanced considerably in the 22 months since. That makes this a conservative benchmark for what Cradle can do today.
How the benchmark was built
AIntibody was modeled on CASP, the structure-prediction competition that pushed that field toward honest self-assessment. The organizers closed most of the usual escape routes: Sequences were submitted before expression, so nobody could screen first and report later. In total, 511 antibodies were expressed and measured, with entries coming from academic labs, large pharma, mid-size biotech, AI biotechs and big tech.
The target was the receptor-binding domain of SARS-CoV-2, picked because it is about as well characterized as an antigen gets. Everyone received the same sequencing readout from a yeast-display selection campaign, plus measured affinities for 142 antibodies.
What makes this benchmark different
Most reported results in computational protein design are retrospective. A group runs its method, picks what to show, and publishes. AIntibody was modeled on CASP, the structure-prediction competition that ran for two decades and eventually made that field's claims trustworthy. Both worked the other way around: Participants submitted sequences before pre-synthesis, so nobody could run a design, see the data, and then decide which results to report. A single vendor manufactured every antibody in the same format, which removes the possibility that one group's numbers look better because of how their molecules were produced. The labs doing the measuring were blind to whose antibody they were testing. The combination of prospective submission, uniform expression, blinded assay is what separates a benchmark from a press release.
Blinded, prospective, third-party-assayed benchmarks are rare in protein design, and building one on this scale is genuinely hard work. We are super appreciative of the organizers’ pulling this together. We would like to see more of these!
Where we landed
Ranks are naturally going to get the attention, but we care more about our success rate.
In challenge two, every one of our submissions bound the target. The participants as a whole did worse than random: Across the three clusters, only 9.8% to 13.8% of AI submissions improved on the cluster control, while randomly picked clones improved on it 39% of the time.
Our model also performed well ranking the clusters against each other. We predicted 27F would be tightest, then 47F, then 28F. The best binders we measured in each came back in that order.
What no one managed was picking the best clone within a cluster. In that top band, our scores differed by only a few percent while measured affinities differed two-to-five-fold. With only three picks per cluster, that comes down to chance.
In a real campaign, we wouldn't spread picks evenly per cluster, but instead put most of the plate into the highest-ranked cluster, and with the winners already in our top 1%, we feel confident we’d find the best candidate.
Our takeaway: Models built on selection data are good at telling families apart and weak within the HCDR3 cluster. Selection screens tell you where the peaks are, not how high they are or what surrounds them. Solving this requires better screening methods.
From a relevance perspective, the antibody design challenge is most interesting—for us, for the AI use case, and for most customers. All of ours were hits, with three of our ten designs coming in under 10 pM.
For a biologics team, the functional rate is the operationally relevant figure. Seven of our ten cleared the developability panel. That’s a round you can plan a campaign from. Across the challenge as a whole, 30.4% of submissions from all organizations didn't bind at all, which makes the developability question moot.
Across all four entries, all 19 of our submissions bound the target.
Rank-ordered box-and-jitter plots of the top 20 of 23 participating organizations by best SPR affinity, showing the distribution of affinity per organization (in purple) relative to the experimental baseline (in blue). Each plotted point is one independent antibody construct. Boxes show the median (center line), 25th–75th percentiles (bounds) and 1.5× the IQR (whiskers); all individual points are overlaid as jitter. Graphic redesigned (data unchanged) and caption lightly edited from Erasmus, M.F., Bedinger, D., Hopkins, E. et al. “A blinded, prospective benchmark of in silico antibody discovery anchored to experimental affinity and developability.” Nat Biotechnol (2026). https://doi.org/10.1038/s41587-026-03238-6 and reproduced under Creative Commons license
The developability panel, assay by assay
The challenge scored five assays, each marked 0 for passing, 1 for questionable and 2 for failing, with a cumulative score of 3 or less counting as a pass. Thermal stability above 65 °C, aggregation temperature above 64 °C, hydrophobic interaction retention under 13.87 minutes, baculovirus particle polyreactivity under 5.3, AC-SINS self-interaction under 6.69.
Our ten designs passed thermal stability and aggregation across the board. Developability scores were not reported for generating the designs. The candidate we used as template sequence had both poor polyreactivity, and hydrophobicity, which we inherited, and every failure we recorded was hydrophobicity or polyreactivity.
That includes our best binder. Submission 1586, the 8.69 pM design, is questionable on hydrophobic interaction at 14.9 minutes and fails polyreactivity outright at a BVP score of 20.6 against a failing threshold of 10. It reaches a composite of 3 and passes by exactly the allowed margin. Two of our other sub-10 pM designs produced no peak on the hydrophobic interaction column at all.
Why developability sits alongside affinity
Affinity is how tightly an antibody grips its target, and it is the number most discovery programs lead with. Developability is everything else that determines whether a molecule can become a drug: whether it stays folded at body temperature, whether it clumps together at the concentrations needed for a syringe, whether it sticks to surfaces or to proteins it was never meant to bind. These properties are measured in this benchmark across five assays covering thermal stability, aggregation, hydrophobicity, polyreactivity and self-interaction. The reason they belong in the same conversation as affinity is economic. Affinity problems surface early and get fixed with another round of engineering. Developability problems often surface after a lead has been chosen, during scale-up or formulation, when fixing them means going back to a molecule that an entire program has already been built around. We believe that a benchmark that scores both is asking a harder and more realistic question than one that scores affinity alone.
Not included in the report is that the top candidate failed on purification, which would disqualify it as a candidate under standard therapeutic development criteria.
Affinity is the property that moves most readily under optimization (up to a ceiling). In our own first-round antibody campaigns we have seen single rounds produce notable affinity gains without affinity even being the objective. It responds.
The properties that do not respond as cleanly are the ones that kill programs late and expensively. Aggregation, polyreactivity, hydrophobicity, and thermal stability tend to show up as problems after a lead has been selected, when the cost of going back is a program delay rather than a plate. Holding those steady while affinity moves is a part of an antibody campaign that is quite difficult.
The data we trained on
Challenge 3 is worth looking at closely if you are trying to work out where an ML platform earns its place in a discovery workflow. Because the data situation we were given is quite similar to what we have seen in many of the dozens of programs run on Cradle’s platform.
We had a yeast-display selection readout, which is hit identification output. We had one round of affinity measurements on 142 antibodies, which is the first lead-optimization data point.
Why the starting data mattered as much as the model
Participants in the design challenge received two things: sequencing output from a yeast-display selection campaign, which is the kind of data a hit-identification run produces, and measured binding affinities for 142 antibodies, which is the kind of data a first optimization round produces. This is a situation we would typically be in during a campaign–the phase where fine-tuned ML models are no longer just producing data for further training, and become reliable. Some protein engineering workflows treat hit identification and lead optimization as separate stages with separate tooling. The screening data is used to pick leads and then set aside. Training a model on both signals together produced a design tighter than anything the selection campaign itself had found. The screening data was not just a source of candidates, but training data for the optimization that followed.
First we evotuned on the multiple sequence alignment and high read-count screening sequences. We built a predictor with two output heads, one for enrichment in the screening data and one for affinity, trained jointly on both signals. Four folds were ensembled, and a noise-masking procedure turns each prediction into a distribution rather than a single number. So every sequence carries a mean and a confidence range rather than a point estimate. For the design challenge we blocked every position outside the six CDRs so the challenge rule was enforced by the software rather than by inspection, then used a masked language model to infill eight CDR positions at a time across 200,000 masks, deduplicated the output, and scored it with the same ensemble. The ten we submitted were spread across four selection strategies, from conservative ranking to an exploration arm favoring heavier mutation loads.
How Cradle generates the designs. The run starts from a template sequence and writes new CDR variants, each with a set number of mutations, all defined within Cradle’s UI. Image not representative of competition submission.
From a selection readout plus one affinity round, with no structural input, that produced a design tighter than anything in the library the selection campaign had generated. This is the argument for running hit ID and early optimization through the same model rather than treating them as sequential, separately-tooled stages: Using the same models to learn from screening data and plate-based binding data maximizes learning. So the screening data becomes not just a source of leads, but training data for the optimization that follows. When you’re doing things the old way, information is lost between those steps.
The run locks every position outside the CDRs, so new sequence appears only in the CDR regions. This enforces the challenge rule in the Cradle platform, together with the scientist’s knowledge. Image not representative of competition submission.
From a selection readout plus one affinity round, with no structural input, that produced a design tighter than anything in the library the selection campaign had generated. This is the argument for running hit ID and early optimization through the same model rather than treating them as sequential, separately-tooled stages: Using the same models to learn from screening data and plate-based binding data maximizes learning. So the screening data becomes not just a source of leads, but training data for the optimization that follows. When you’re doing things the old way, information is lost between those steps.
Where the model had resolution, and where it did not
Earlier in this post we discussed the performance of our predictor in the rank-prediction challenge. Picking the single best sequence inside a cluster is a harder problem, and our within-cluster ordering was much weaker than our between-cluster ordering. The sequences
inside one of these clusters are near neighbors, and a model asked to separate near neighbors is working at a resolution where small prediction differences sit well inside assay variance. (There is more to say about what selection-derived sequencing data can and cannot carry, and we plan to publish that separately.)
Spread across each challenge's ranked submissions. "Best" is the top affinity recorded; "10th best" is the tenth-ranked entry (roughly where a top-10 cutoff would fall). "Top-10 spread" is the ratio between them — how much affinity varies among just the leading submissions. "Full spread" is the same ratio across every entry. In the design challenge, the top 10 alone span a 62-fold range, and the full field spans nearly 100,000-fold. A single best-binder result sits at one end of that wide distribution, which makes for a resolution problem in the top-1 scoring method.The margin of top performers is a lot narrower on the ranking challenge, making it more susceptible to data noise.
That has a practical consequence for how any of this gets scored. Organization ranking here was effectively top-1, with near ties broken by hit rate. Top-1 rewards the single best submission, which carries real variance; hit rate smooths that out but rewards conservative submissions. Our platform optimizes for an average top-N, usually between 5 and 10, because that is the quantity a lab cares about when it advances candidates from a plate, and because it is more stable run to run.
Organizers are already rethinking the developability scoring, noting that the top-ranked antibody’s failure on one assay was “allowed…to be offset by favorable performance elsewhere, [which] exposes a limitation in the present scoring design and the need for critical future go/no-go criteria.” With respect and gratitude to the organizers, we’d add that many sequences “passed” or “failed” by super small margins and didn't include all relevant properties (which is the caveat of the winning sequence), making the cutoff somewhat arbitrary. We’d also like to make two suggestions we think would make the next AIntibody Challenge even more valuable to everyone who entered: Release the per-submission raw data, so the community can recompute rankings under top-3, top-5 or top-10 and see how much the ordering moves. Second, state the scoring metric upfront so entrants can optimize for the thing being measured.
What we left switched off
One caveat on everything above. We ran the generation through a stripped-down manual path, and the final ten picks came from a score ranking rather than the batch-level optimizer that normally decides what goes on a plate. These results reflect our models and our data, not the full platform.
The experiment we would most like to see next is multi-round. This benchmark measured what one pass at a fixed dataset can do. Every campaign we run with a customer is iterative, with each round's assay results retraining the models before the next design, and the gap between one-shot and closed-loop performance is the number nobody has published under blinded conditions yet. If the organizers run a multi-round version, we will enter enthusiastically.
Full results and every participant's data are in Nature Biotechnology. The challenge design and original call for participants are at aintibody.org.
Recent posts
Subscribe and get new posts and updates from Cradle straight to your inbox.


Follow Cradle
Built with ❤️ in Amsterdam & Zurich
Follow Cradle
Built with ❤️ in Amsterdam & Zurich
Follow Cradle